Anaglyphes
Vidéo d’explication.
Remarques : Certaines personnes ne voient pas les images en relief donc pas d’inquiétude… Regardez la calculatrice en vous éloignant d’au moins 50 cm et bien la tenir à la verticale (pas sur la table)
Il faut une paire de lunettes rouge-cyan pour voir les images ci-dessous en 3D.

Collection personnelle
Fabriquer des lunettes (avec des marqueurs rouge+bleu et un boitier de CD).
En acheter sur Amazon
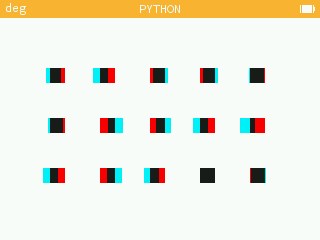
>> go1()
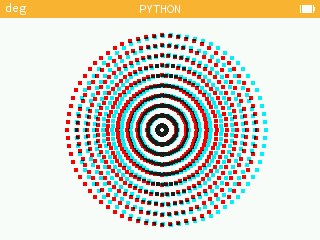
>> go2() (remplacer r//10 par r*r//1600 pour obtenir une paraboloïde)
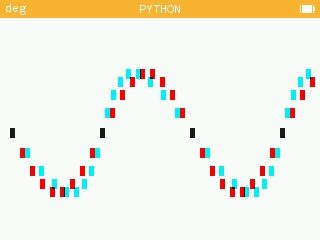
>> go3()
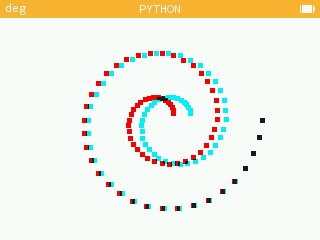
>> go4()
>> go5() (courbes de Lissajou, regardez-là se construire en 3D sur l’écran de votre machine. Testez go5(2) puis go5(3) puis go5(5) etc et observez les différences)
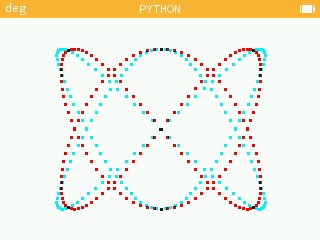
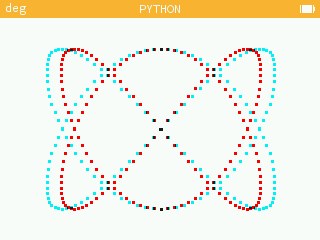
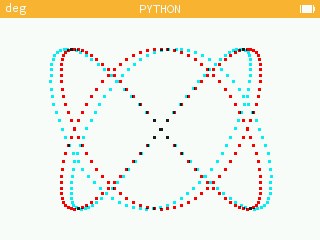
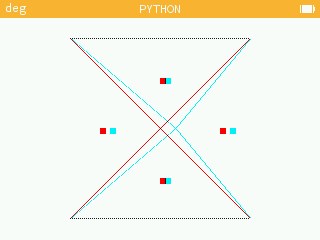
>> go6() (Pyramide vue du dessus et 4 points)
>> go7() (Plantes grimpantes)
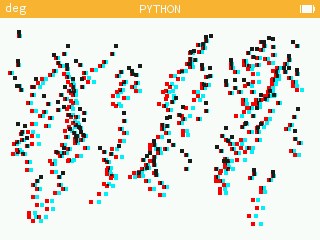
from kandinsky import *
from math import *
from random import *

CYAN = color(0,240,248)
ROUGE = color(248,0,0)
GRIS = color(24,28,24)
BLC = color(248,252,248)

# un rectangle rouge ou bleu
def rect(x,y,l,h,z,coul):
  for i in range(l*h):
    c = get_pixel(x+z+i%l,y+i//l)
    if c!=GRIS and c!=coul:
      set_pixel(x+z+i%l,y+i//l, coul if c==BLC else GRIS)

# un rectangle en 3D
def dessin(x,y,z,l,h):
  rect(x,y,l,h,0, ROUGE)
  rect(x,y,l,h,z, CYAN)

# Les exemples 1 a 7
def go1(l=15,h=15):
  for i in range(50,300,50):
    for j in range(50,200,50):
      dessin(i,j,randrange(-10,10),l,h)

def go2(l=4,h=4):
  for r in range(5,100,10):
    for i in range(0,360,5):
      x = int(160+r*cos(radians(i)))
      y = int(110+r*sin(radians(i)))
      dessin(x,y,r//10,l,h)

def f(x):
  return sin(radians(x))

def go3(l=5, h=10):
  for z in range(0,640,4*l):
    x = int(10+z/2)
    y = int(110+60*f(z))
    dessin(x,y,int(15*f(z)),l,h)

def go4(l=5,h=5):
  for z in range(0,700,10):
    x = int(160+(100-z/8)*cos(radians(z)))
    y = int(100+(100-z/8)*sin(radians(z)))
    dessin(x,y,z//40,l,h)

def go5(p=1):
  l,h = 3,3
  for i in range(0,360,2):
    for j in range(0,360,2):
      x = int(160+100*sin(2*radians(i)))
      y = int(110+80*sin(3*radians(i)))
      z = int(15*sin(p*radians(i)))
      dessin(x,y,z,l,h)

def go6(l=2,h=2):
  for i in range(90):
    dessin(160+i,110+i,15-i//6,l,h)
    dessin(160+i,110-i,15-i//6,l,h)
    dessin(160-i,110+i,15-i//6,l,h)
    dessin(160-i,110-i,15-i//6,l,h)
    dessin(70+2*i,20,0,l,h)
    dessin(70+2*i,200,0,l,h)
  dessin(100,110,10,6,6)
  dessin(220,110,10,6,6)
  dessin(160,60,5,6,6)
  dessin(160,160,5,6,6)

def go7(n=80,l=4,h=4):
  pos = [[0,0]]*n
  for i in range(n):
    pos[i] = [randrange(10,300),randrange(10,160)]
    for j in range(randrange(2,10)):
      dessin(pos[i][0],pos[i][1],j,l,h)
      pos[i][0]+=randrange(-2,2)*l
      pos[i][1]+=randrange(1,3)*h