Représentation isométrique de surfaces
Exemple 1
f(x,y) = cos(x*x+y*y)*exp(-x*x-y*y)

xmin,xmax,ymin,ymax=-2,2,-2,2

zmin,zmax=-0.5,0.8
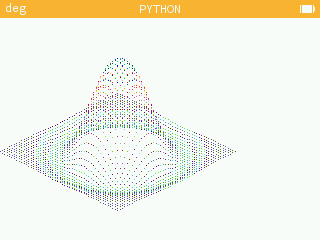
from math import *
from kandinsky import *

xmin,xmax,ymin,ymax=-2,2,-2,2
zmin,zmax=-0.5,0.8
pas=50

def f(x,y):
  return cos(x*x+y*y)*exp(-x*x-y*y)

def trace():
  for j in range(pas):
    for i in range(pas):
      x = xmin + i/pas*(xmax-xmin)
      y = ymin + j/pas*(ymax-ymin)
      z = f(x,y)
      x2=(x-xmin)/(xmax-xmin)
      y2=(y-ymin)/(ymax-ymin)
      z2=(z-zmin)/(zmax-zmin)
      c = int(z)
      xe = int(120*(x2+y2))
      ye = int(180+60*(x2-y2-2*z2))
      set_pixel(xe,ye,(c,c,c))

trace()